
Sunderland’s attacking stats compared to Premier League rivals after Aston Villa blank

Sunderland’s attacking threat compared to their rivals across the Premier League.
Sunderland’s defensive performance in Saturday’s battling draw at Aston Villa was widely praised as the Black Cats kept the likes of Nicolas Jackson, Johan Manzambi and Emi Buendia at bay.
However, Regis Le Bris’ side were unable to provide too much threat in the attacking third as they ended the game by having just one shot on target and a further two were unable to test hosts goalkeeper Zion Suzuki. That has continued what has been a familiar pattern for the Black Cats during the first half of the season as they sit at the bottom of the Premier League’s goals scored table with just eight goals in their 11 league games and only Sunderland and Nottingham Forest have failed to reach double figures so far.
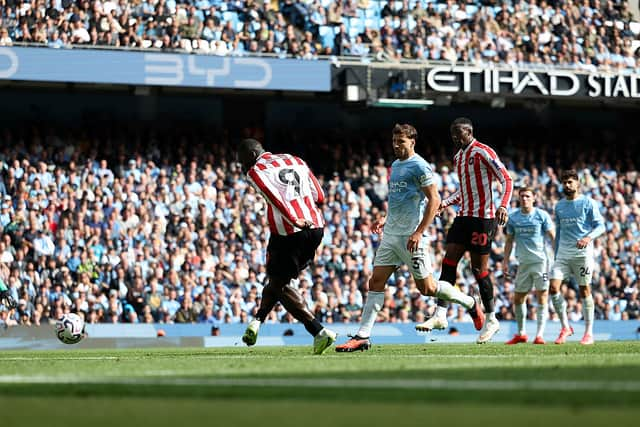

The Black Cats’ lack of attacking threat against Villa and their inability to find the net on a regular basis during the season was a major talking point on Match of the Day on Saturday night with former Manchester City and England goalkeeper Joe Hart assessing the stats racked up by Le Bris’ men.
He said: “Robin Roefs was excellent, but the attacking numbers are definitely going to be concerning. We look at it here. I think shots on target, expected goals, shot conversion, and goals being 20th in the league’s never good, especially with Brian Brobbey injured at the moment. But once they can get him back, and Robin Roefs, as I say, performing at the back, they’ve got a real good chance.”
That came after Le Bris had called for patience when it comes to improving the play in the final third over the coming weeks.
He said: "We are a little bit frustrated [with on the ball play], because you have to exploit the opportunities you have but I think it's just a question of time and confidence. Obviously from the start of the season it was important to switch a little bit. Now we are in the fight really clearly and we have a clear strategy to handle the situation.
"After Chelsea, was it an accident? The answer is no, because we can repeat against another opponent. After that it's a question of just adjusting in transition, the decision making, the accuracy of the last pass or the last decision. It's a question of time."
But how good is the quality of chances Sunderland are creating? We take a look at the Premier League’s average xG (expected goals) to see how they compare to their rivals across the top flight of English football.
Premier League xG table
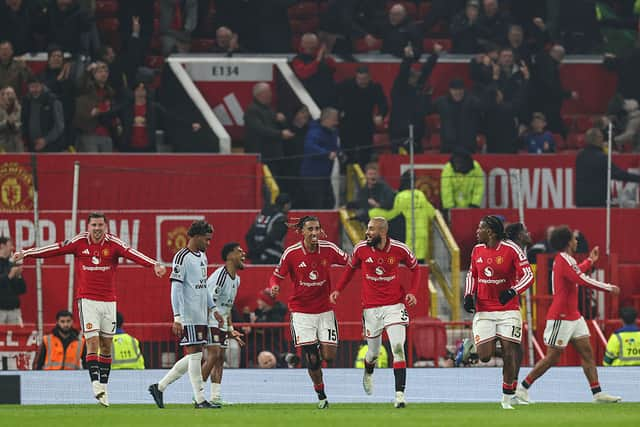
1. Manchester United - 2.03xG
2. Brighton and Hove Albion - 1.82xG
3. Totenham Hotspur - 1.81xG
4. Manchester City - 1.76xG
5. Liverpool - 1.72xG
6. Arsenal - 1.62xG
7. Everton - 1.60xG
8. AFC Bournemouth - 1.59xG
9. Nottingham Forest - 1.59xG
10. Chelsea - 1.57xG
11. Fulham - 1.55xG
12. Brentford - 1.40xG
13. Leeds United - 1.40xG
14. Aston Villa - 1.34xG
15. Newcastle United - 1.32xG
16. Sunderland - 1.28xG
17. Coventry City - 1.27xG
18. Crystal Palace - 1.24xG
19. Ipswich Town - 1.24xG
20. Hull City - 1.12xG
Your next Sunderland read: Régis Le Bris favourite risks Newcastle United derby suspension as Sunderland yellow card warning emerges