

The latest figures show a man in Sunderland can expect, on average, to live until 77.1 years old, around six-and-a-half years less than the average life expectancy for a male living in Hampshire (83.7) and a decade less than a woman living in Kensington & Chelsea (87.1).
The figures also show a female in Sunderland can, on average, expect to live until 81.2, compared to 87.1 in Kensington & Chelsea and 86.8 in Richmond upon Thames.
The figures very much showed a North and South divide and whilst the wealthiest and most affluent parts of the UK have a life expectancy of nearly 90, the majority of Sunderland postcodes are under 80.
However, even within the Sunderland city boundaries there is a significant disparity in how long on average a person can expect to live.
Unsurprisingly, diet, access to open space and exercise, private health care and health education are intrinsically linked to levels of poverty and, as such, how long a person can expect to live.
Check-out the life expectancy in your postcode area.
The figures have been compiled by the Health Equals campaign led by a partnership of organisations including the British Red Cross, Royal College of Paediatrics and Child Health, Local Government Association, Citizens Advice and Mind.
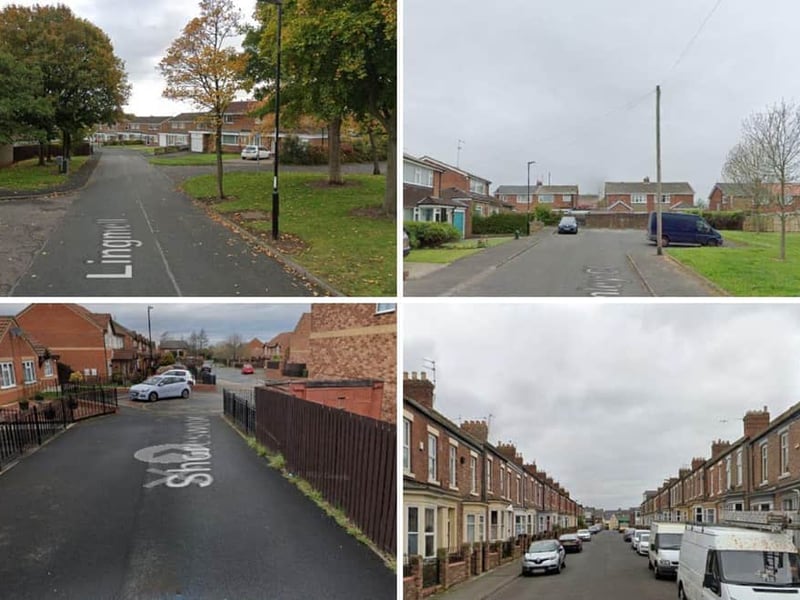
1. Sunderland life expectancy.
The parts of Sunderland with the lowest and highest life expectancy. | Google Photo: Google
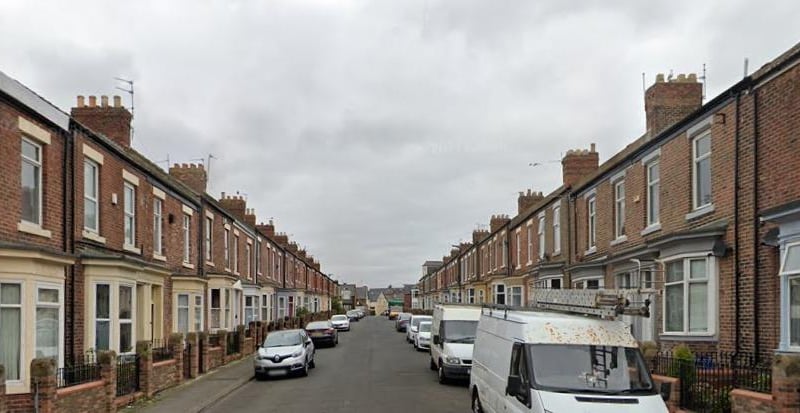
2. SR1 postcode
- Areas covered - Sunderland City Centre, East End and Hendon. - Life expectancy - 76. Photograph: Google Maps Photo: Google Maps
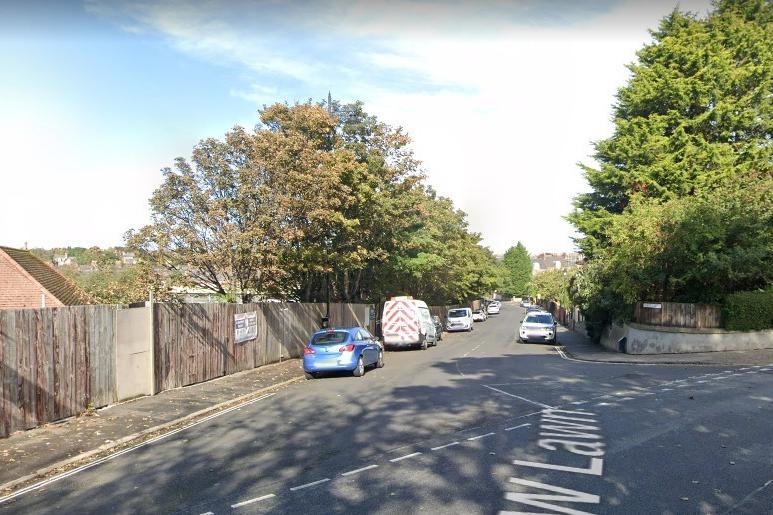
3. SR2 postcode
- Areas covered - Ashbrooke, Ryhope, Grangetown, Hillview and Thornhill. - Life expectancy - 78. Photo: Google Maps | Google Photo: Google Maps
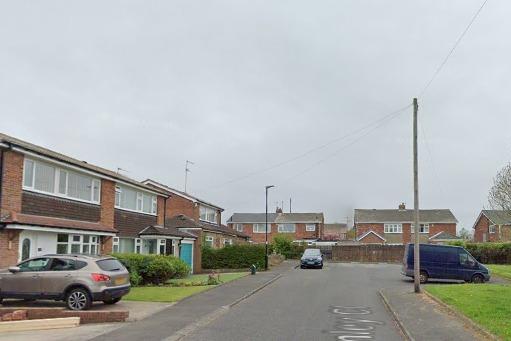
4. SR4 postcode
- Areas covered - Barnes, Chester Road, Deptford, Ford Estate, Grindon, Hastings Hill, Hylton Lane Estate, High Barnes, Pallion, Pennywell and South Hylton. - Life expectancy - 78. Photograph: Google Maps Photo: Google Maps