Map shows just how Covid levels have soared across Sunderland in just a few weeks as cases reach highest ever level
and live on Freeview channel 276
The Government’s own interactive map shows how Sunderland’s Covid rates have jumped into the highest level recorded with more than 800 cases recorded per 100,000 in most areas in just one week.
The data is shared each day via the coronavirus.data.gov.uk/, which shows the latest information including details including how many people are in hospital, vaccination figures, how many tests have been carried out, the number of new cases reported and its weekly figure as well as an update on how many more people have died within 28 days of a test.
Advertisement
Hide AdAdvertisement
Hide Ad

The map allows people to search via postcodes and offers a sliding timeline, so the level of the virus can be tracked through dates back to January this year, showing a seven-day case rate per 100,000 people.
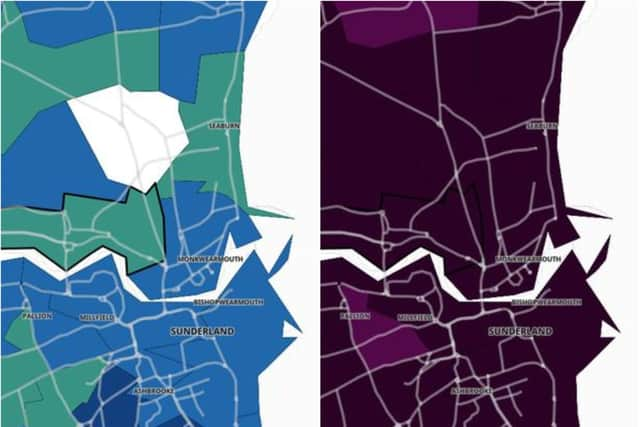
As recent weeks have progressed, it is possible to see how the rates have increased over the period and the colours on the map change, with the lowest figures in bright green, darkening into blue and then shades of purple as they rise.
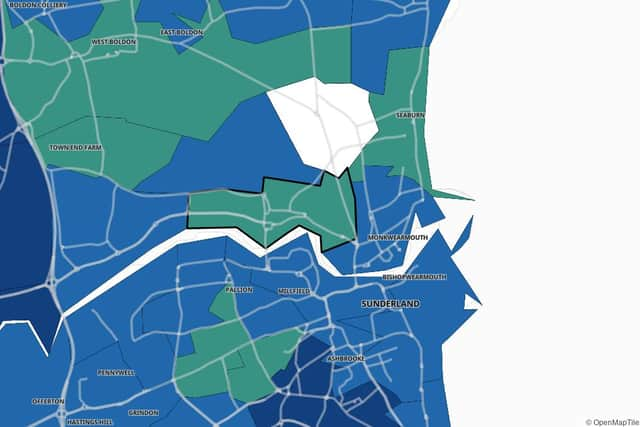
The map shows, for example, on Sunday, June 20, Southwick was a green area, with six cases and a case rate of 80.5 per 100,000 people.
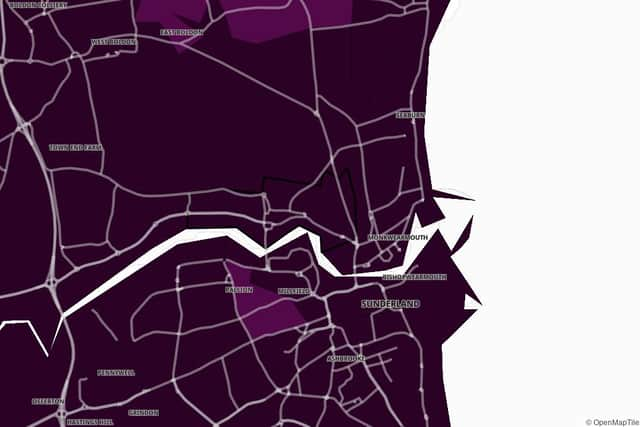
On Sunday, July 11, that had risen to 98 case and a case rate per 100,000 people of 1,314.4.
Advertisement
Hide AdAdvertisement
Hide AdHetton South also has been another area where the rate has soared from low levels up to the second highest, with three cases up to June 20 and a case rate per 100,000 people of 41.3, with the latest numbers up to July 11 showing 55 cases, giving a case rate per 100,000 people of 757.7.
Other areas to leap from green into purple include Seaburn, West Boldon, Town End Farm, Pallion South and High Barnes, Barnes Park, Lakeside and Farringdon, Silksworth and Herrington and Doxford Park.
All areas across Wearside have either seen a rise in cases between 400 and 799 or 800 and above, with Millfield, Cleadon and East Boldon, Harraton, Rickleton and Fatfield and Hetton North the parts of the second top scale and the remainder at the highest level.