
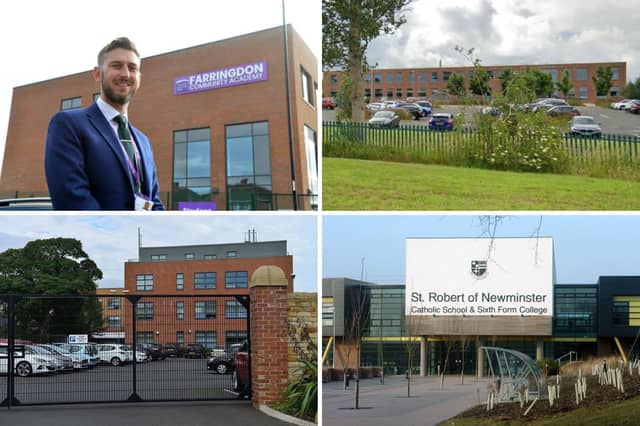


The most recently published data for secondary school’s in Sunderland shows a Progress 8 score of -0.31, meaning that on average the city’s teenagers are achieving almost a third of a grade less in their GCSEs compared to students of similar pre-assessed ability across the country.
To calculate Progress 8, each school is given a statistically calculated positive or negative value which is used to assess the progress made by pupils of the same assessed starting point when they sat their Standard Assessment Tests (SATs) in Year 6 and the results then achieved in their GCSEs in Year 11.
Whilst a number of the city’s secondary schools currently have a positive Progress 8 score, the majority have a negative value, meaning on average pupils generally did less well in their GCSEs than children of similar pre-assessed ability nationally.
Speaking about the attainment disparity, Sunderland MP Mrs Phillipson said: “What we face at the moment is a very stark gap in terms of regional inequality and a big gap in terms of attainment with our young people.
“We have to recognise the challenges we see around some of the long standing regional inequalities, including here in Sunderland - something which I feel hasn’t been confronted for a very long time.”
Progress 8 was introduced in 2016 as a fairer way to assess a school’s academic performance, rather than simply looking at raw grades and outcomes.
A score above zero represents that pupils made more progress, on average, than pupils across England who got similar results at the end of Year 6 while a score below means, on average, they made less.
A score of plus one means that pupils with the same SATs results are achieving, on average, one grade more than their national peers in their GCSEs, while a score of minus one, means on average they are attaining one grade less.
Check out the current Progress 8 scores for all our city’s secondary schools.
The scores are based on the 2024 cohort of GCSE students, with updated figures for the most recent (2025) students to sit their GCSEs due out later this year.
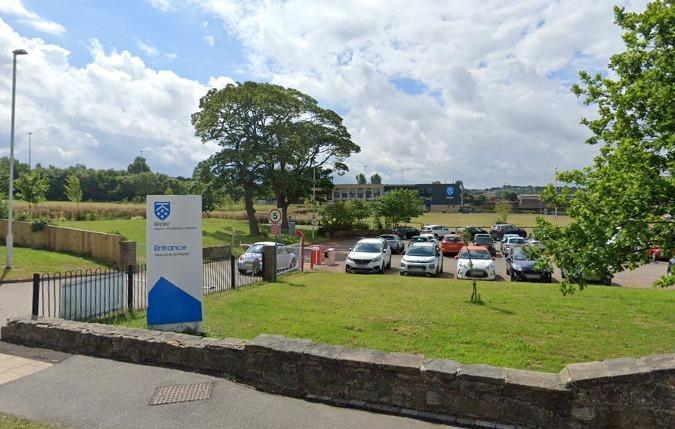
13. Kepier School
Kepier School achieved a Progress 8 score of -0.29 which is above the local authority average of -0.31. Children's progress was classed as 'below average' compared to their national counterparts. Photo: Google
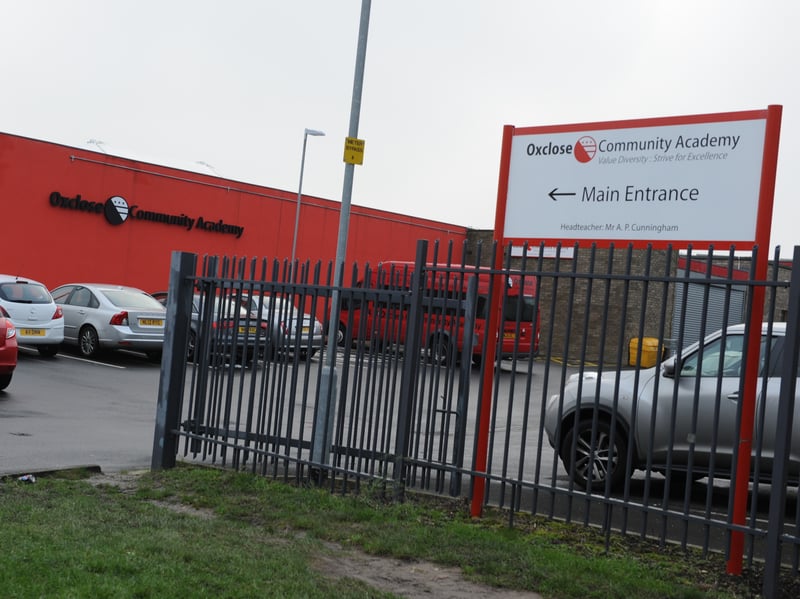
14. Oxclose Community Academy
Oxclose Community Academy has a Progress 8 score of -0.37 which is below the local authority average of -0.31. Children's progress was classed as 'below average' compared to their national counterparts. | National World Photo: Neil Fatkin
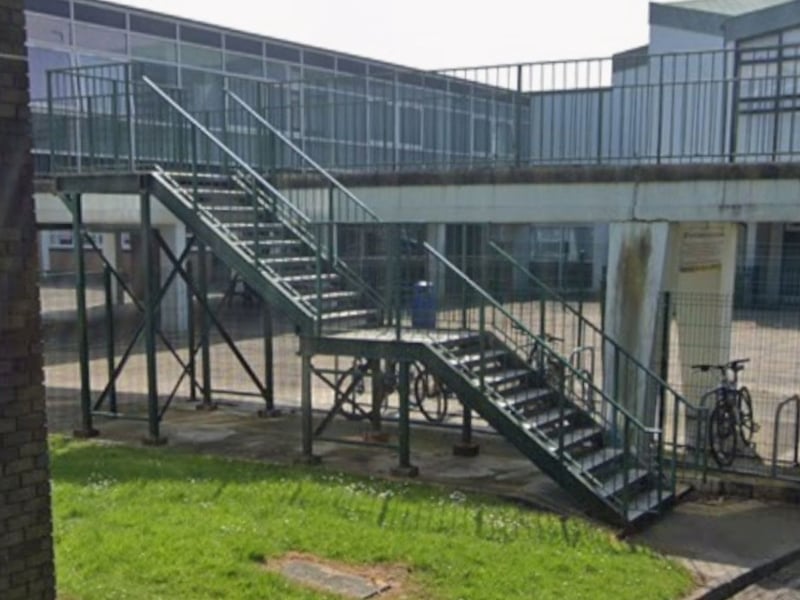
15. Thornhill Academy
Thornhill Academy has a Progress 8 score of -0.4 which is below the local authority average of -0.31. Children's progress was classed as 'below average' compared to their national counterparts. | Google Photo: Google
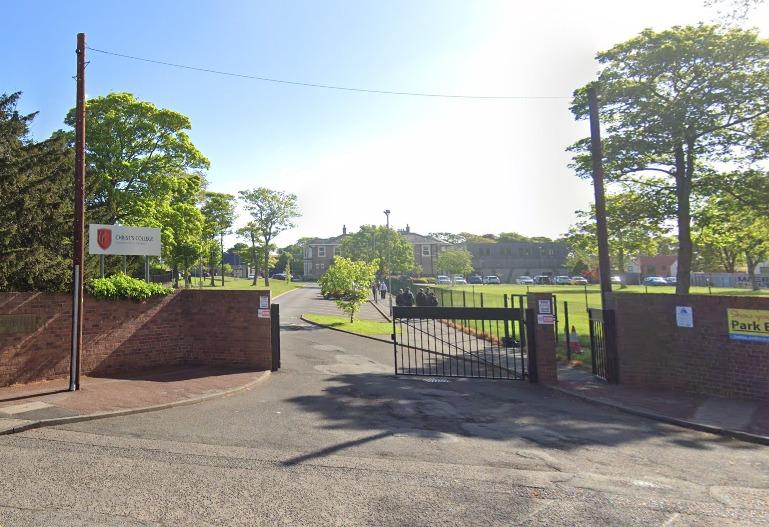
16. Christ's College
Christ's College has a Progress 8 score of -0.68 which is below the local authority average of -0.31. Children's progress was classed as 'well below average' compared to their national counterparts. Photo: Christ's College