
Sunderland’s journey over the past five seasons has been a tough one with relegations and subsequent failures to get themselves back into the Championship have meant that their finances have taken a hit.
With finances this in mind, having money available to spend on transfers has been limited at the Stadium of Light and a need to sell their best players has become an all too familiar sight on Wearside.
However, Sunderland are not alone in this with many other League One sides finding themselves in the same predicament.
Here, using data provided by Transfermarkt, we take a look at how the net spend for each side in the top-half of League One differs from club to club and the huge gulf between the team who have spent the most, compared to the team that have made the most money in that time:
A message from the Football Clubs Editor
Our aim is to provide you with the best, most up-to-date and most informative Sunderland AFC coverage 365 days a year.
This depth of coverage costs, so to help us maintain the high-quality reporting that you are used to, please consider taking out a subscription to our new sports-only package here.
Your support is much appreciated. Richard Mennear, Football Clubs Editor
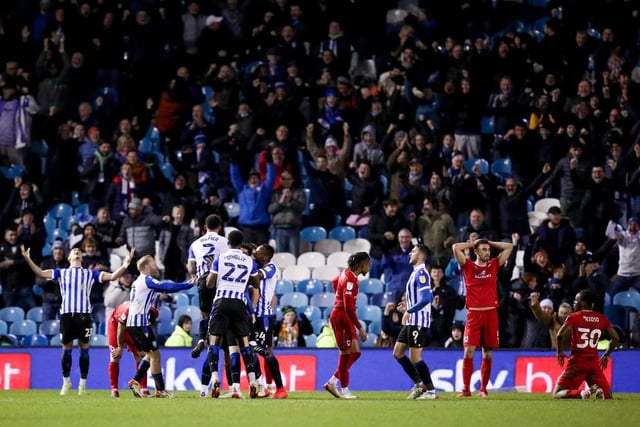
1. Sheffield Wednesday
Total Net Spend: £18.4m Highest Net Spend: £13.68m (2017/18) Lowest Net Spend: -£3.87m (2019/20) Photo: George Wood

2. MK Dons
Total Net Spend: £236,000 Highest Net Spend: £1.35m (2021/22) Lowest Net Spend: -£660,000 (2017/18) Photo: Clive Mason
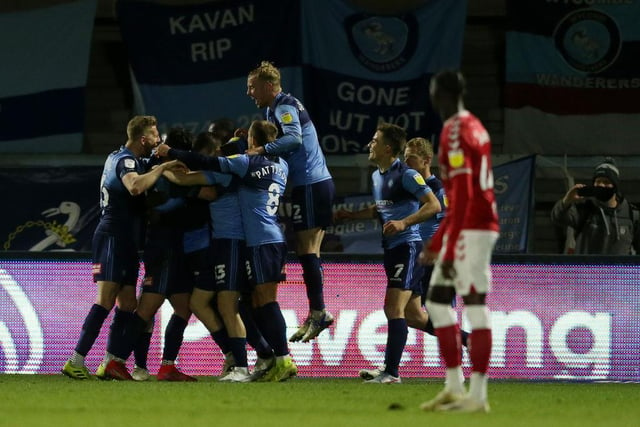
3. Wycombe Wanderers
Total Net Spend: -£783,000 Highest Net Spend: £0 (2016/17, 2017/18, 2018/19, 2019/20, 2020/21) Lowest Net Spend: -£783,000 (2021/22) Photo: Paul Harding

4. Plymouth Argyle
Total Net Spend: -£803,000 Highest Net Spend: £0 (2017/18, 2019/20, 2020/21, 2021/22) Lowest Net Spend: -£504,000 (2018/19) Photo: Alex Davidson