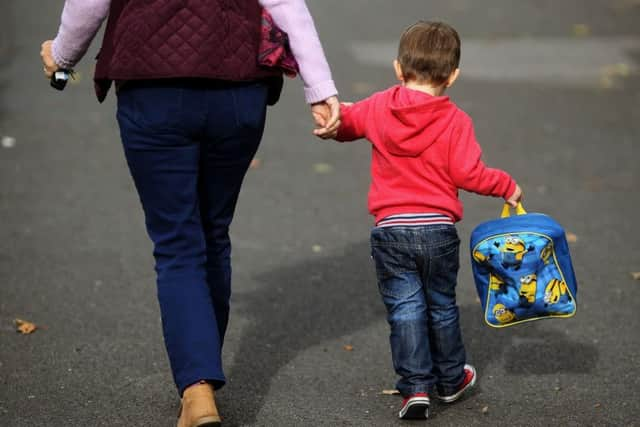
Almost a third of Sunderland children living in poverty


The figure averages almost a third of the city’s children and shockingly the figure rises to almost half of children, 45%, living in the Hendon ward are in financial hardship.
Sharon Hodgson, MP for Washington and Sunderland West, Shadow Minister (Public Health) and previously a member of the Children, Schools and Families Committee, said the figures are very concerning.

Advertisement
Hide AdAdvertisement
Hide AdShe said: “It is deeply shocking that such a high percentage of children are living in poverty in Sunderland.
“After years of austerity from this Tory Government it is clear that families are struggling to cope and it is children who are bearing the brunt of callous Tory policies.
“These statistics are incredibly concerning, and I will be challenging the Government on these figures and the effect of their policies.”
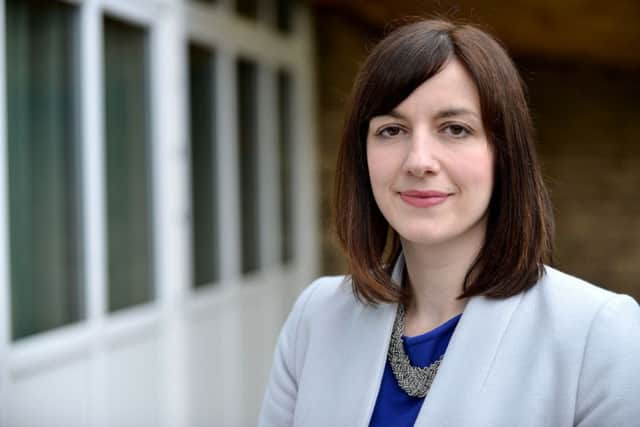
Fellow Wearside MP. Bridget Phillipson, who represents the Houghton and Sunderland South ward, said: “These figures are troubling reading for anyone who cares about our children, and the future of the country.
Advertisement
Hide AdAdvertisement
Hide Ad“It is simply unacceptable that in the 21st Century, so many children continue to grow up in avoidable poverty.
“It is especially concerning that two thirds of those growing up in poverty come from working families.
“Tackling such shocking levels of inequality should be a top priority for the government – but I am concerned that its policies are only making this situation worse, particularly the chaotic and ill-judged roll out of Universal Credit.
“This is a stark reminder that there is much more work to do in order to give all children the start in life that they deserve.”
Advertisement
Hide AdAdvertisement
Hide AdThe figures, by the End Child Poverty coalition, show some of the most deprived areas of the UK have seen the biggest increases in child poverty since the last report in 2015.
A child is said to live in poverty if they are in a family living on less than 60% of median household income.
According to the latest official statistics 60% of median income (after housing costs) was around £248 per week.
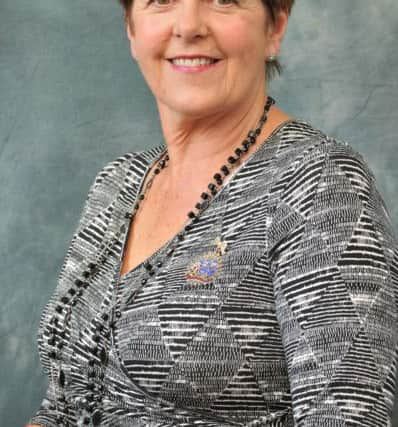
Coun Louise Farthing, Sunderland City Council’s cabinet member for children, learning and skills, said: “While our city’s work on tackling child poverty continues, we have seen over the last eight years a systematic dismantling of the support systems brought in between 1997 and 2010 and it is no surprise that child poverty increases as a result.
Advertisement
Hide AdAdvertisement
Hide Ad“The solution to this problem lies in Whitehall and the Government needs to give local councils the resources they need to tackle the problem.
“The City Council, working with its partners across Sunderland, continues to work hard on reducing these figures in difficult economic conditions.
“We have a city strategy which responds to the needs of the whole family, including measures such as improving parenting and life skills, reducing teenage pregnancies, improving educational attainment, addressing the issue of young people not in education, employment or training, and getting more parents into work.
“We are very aware that the school holiday period can also put an additional strain on family finances and have a number of schemes to address holiday hunger and increased the number of school holiday activities.”
The number of children and percentage living in poverty.
Sunderland 17,672, 30.84%
Barnes 778, 34.40%
Castle 819, 30.69%
Copt Hill 754, 29.68%
Doxford 312, 17.44%
Fulwell 203, 10.34%
Hendon 1,118, 45.07%
Hetton 803, 33.19%
Houghton 602, 26.34%
Millfield 971, 43.56%
Pallion 924, 39.25%
Redhill 1,105, 41.15%
Ryhope 634, 27.82%
St Anne’s 890, 33.35%
St Chad’s 483, 27.60%
St Michael’s 305, 18.36%
St Peter’s 346, 21.41%
Sandhill 911, 37.50%
Shiney Row 779, 26.46%
Silksworth 697 30.66%
Southwick 898, 37.73%
Washington Central 528, 24.00%
Washington East 688, 28.68%
Washington North 925, 35.72%
Washington South 396, 20.33%
Washington West 634, 25.36%