
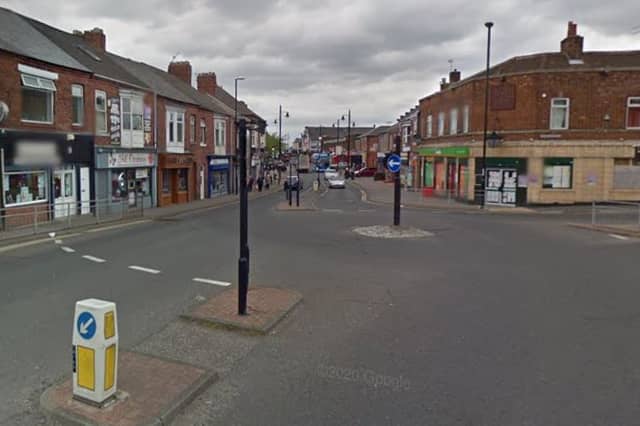


The air quality in parts of Sunderland is so bad that it is more than double, and in some cases nearly three times, the World Health Organisation’s guideline for clean air of 10 micrograms per cubic metre (µg/m3) of nitrogen dioxide (NO2).
However, unlike some other cities, there are no spots where the concentration of nitrogen dioxide exceeds the legal threshold in the UK of 40 µg/m3.
And the latest figures do show that Sunderland’s air quality is improving, with no areas now where NO2 levels are above 30 µg/m3, compared with eight in 2019.
Air pollution is one of the UK’s biggest silent killers, claiming up to 36,000 lives in the UK people in the UK every year.
We’ve looked at the latest data available to show the local roads around Sunderland with the worst recorded air pollution.
The figures are taken from the 2024 Air Quality Annual Status Report published by Sunderland City Council, which contains data for 2023.
Below are the streets in Sunderland with the highest recorded air pollution, listed in reverse order, with the worst last.
Do you have a house hunting story or tips to share? You can now send your stories to us online via YourWorld at www.yourworld.net/submit. It's free to use and, once checked, your story will appear on our website and, space allowing, in our newspapers.
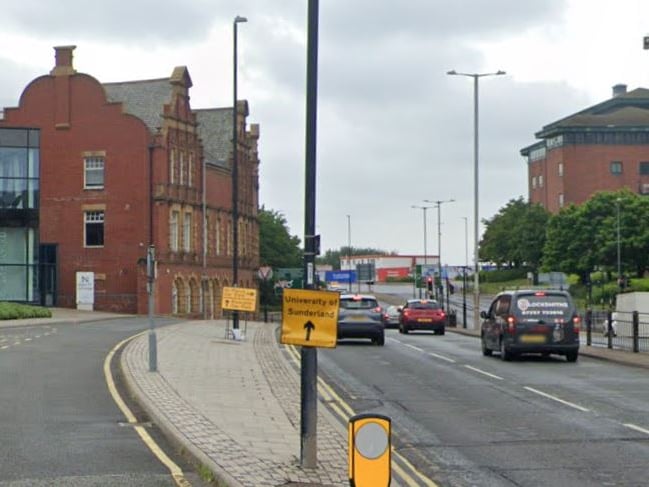
5. Hind Street - 21.8 µg/m3 NO2
Hind Street, off St Michael's Way, is the 9th most polluted spot in Sunderland, according to the latest air quality data. The 21.8 µg/m3 annual mean concentration of nitrogen dioxide (NO2) recorded there in 2023 is more than double the WHO's recommended limit. | Google Photo: Google
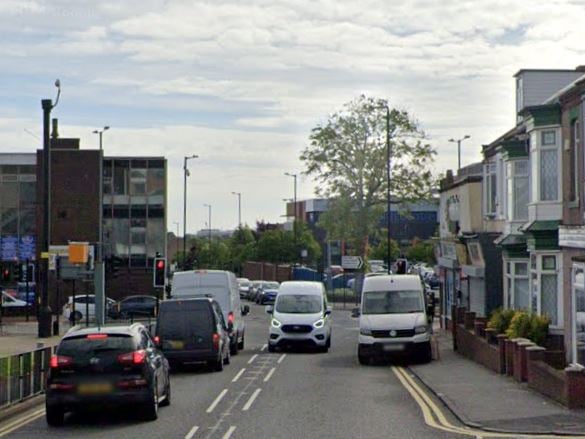
6. Whitehall Terrace - 22.1 µg/m3 NO2
Whitehall Terrace is the 8th most polluted spot in Sunderland, according to the latest air quality data. The 22.1 µg/m3 annual mean concentration of nitrogen dioxide (NO2) recorded there in 2023 is more than double the WHO's recommended limit. | Google Photo: Google

7. Parkside South - 23.6 µg/m3 NO2
Parkside South, East Herrington, is the 7th most polluted spot in Sunderland, according to the latest air quality data. The 23.6 µg/m3 annual mean concentration of nitrogen dioxide (NO2) recorded there in 2023 is more than double the WHO's recommended limit. | Google Photo: Google
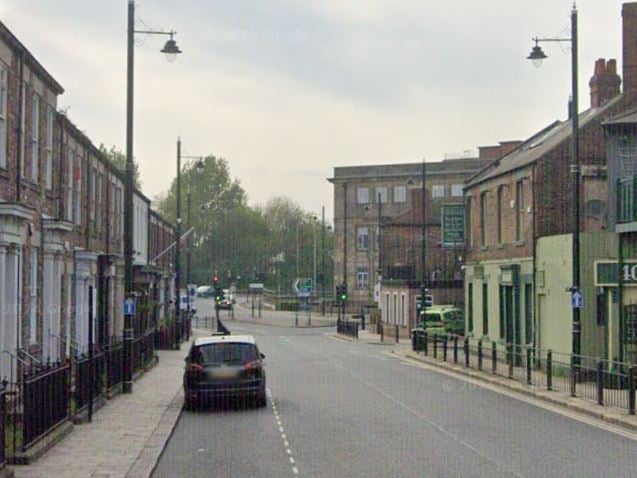
8. Mary Street - 24.3 µg/m3 NO2
Mary Street is the 6th most polluted spot in Sunderland, according to the latest air quality data. The 24.3 µg/m3 annual mean concentration of nitrogen dioxide (NO2) recorded there in 2023 is more than double the WHO's recommended limit. | Google Photo: Google