

According to the latest government data, Sunderland recorded a rate of 306.6 cases per 100,000 in the seven days leading up to March 9 – with 852 people testing positive for the virus.
By comparison, at the start of the month, Wearside had a rate of 221 per 100,000 people, equating to 614 cases over the seven day period leading up to March 1.
Currently, Fulwell has seen the biggest jump in cases, with a 188.9% rise in the last seven days.
Data for the last five days is unavailable as it may be inaccurate or incomplete.
Here we reveal the areas of Sunderland where Covid-19 cases that have seen the biggest increase in cases in the week leading up to March 9.
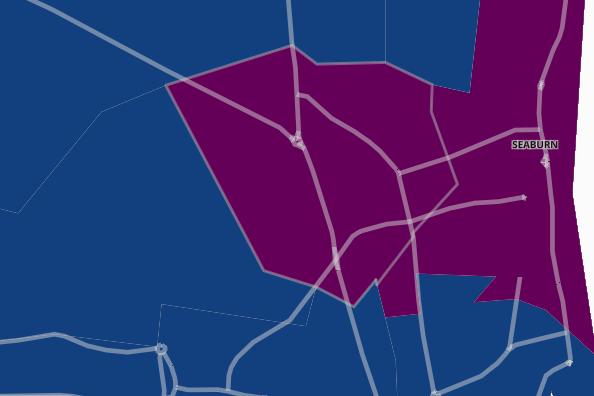
1. Fulwell
In the seven days up to March 9, Fulwell recorded a case rate of 471.7 per 100,000 people. A total of 26 cases were recorded - a rise of 188.9% from the previous week. Photo: Gov.uk
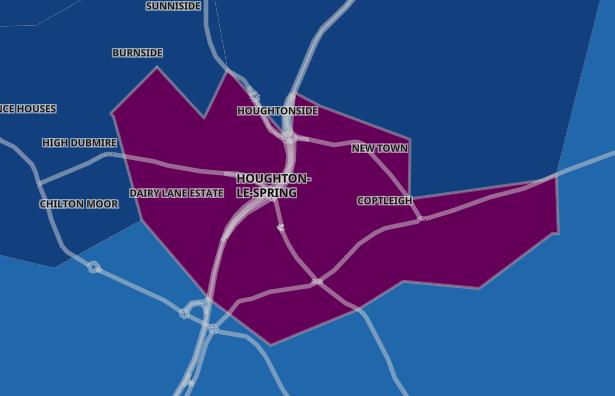
2. Houghton Town
In the seven days up to March 9, Houghton Town recorded a case rate of 405.2 per 100,000 people. A total of 35 cases were recorded - a rise of 169.2% from the previous week. Photo: Gov.uk
3. Hill View and Tunstall
In the seven days up to March 9, Hill View and Tunstall recorded a case rate of 447.4 per 100,000 people. A total of 45 cases were recorded - a rise of 136.8% from the previous week. Photo: Gov.uk
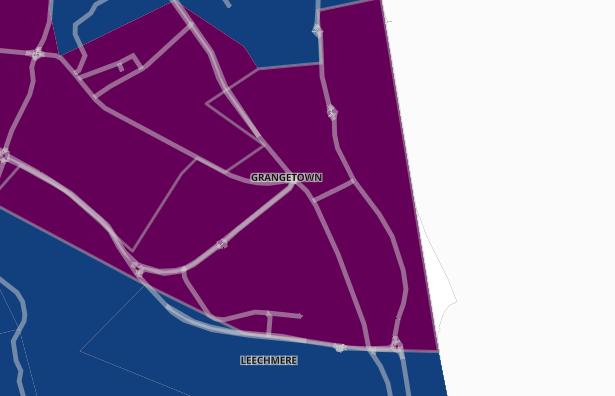
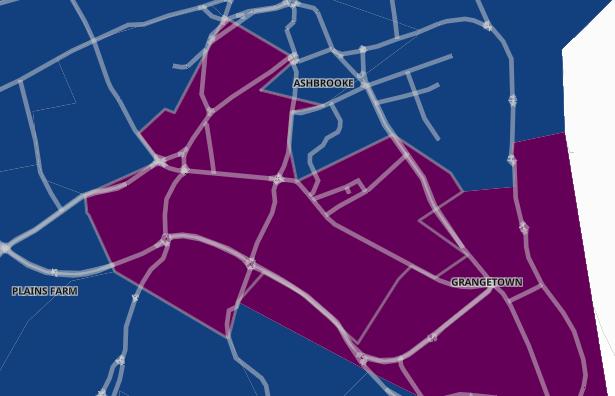
4. Grangetown
In the seven days up to March 9, Grangetown recorded a case rate of 488.5 per 100,000 people. A total of 30 cases were recorded - a rise of 114.3% from the previous week. Photo: Gov.uk