

According to the latest government data, Sunderland recorded a rate of 654 cases per 100,000 in the seven days leading up to March 20 – with 1,817 people testing positive for the virus.
By comparison, at the start of the month, Wearside had a rate of 221 per 100,000 people, equating to 614 cases over the seven day period leading up to March 1.
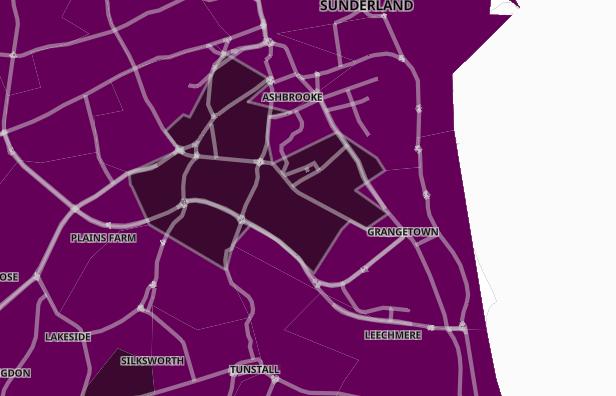
Currently, Seaburn is the worst affected area with 1,072.2 cases per 100,000 people.
Data for the last five days is unavailable as it may be inaccurate or incomplete.
Here we reveal the areas of Sunderland where Covid-19 cases that have seen the biggest increase in cases in the week leading up to March 20.
Currently, Seaburn is the worst affected area with 1,072.2 cases per 100,000 people.
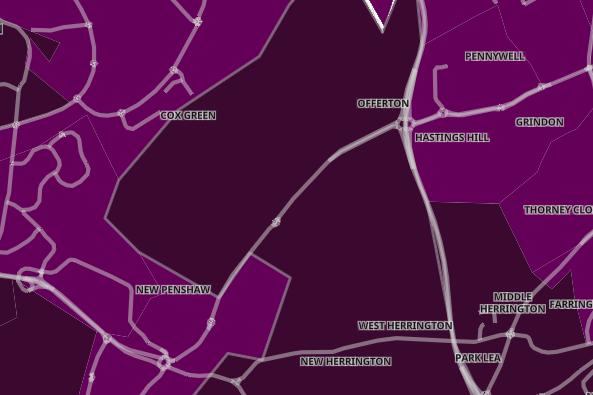
5. Newbottle and Penshaw
In the seven days up to March 20, Newbottle and Penshaw recorded a case rate of 835.1 per 100,000 people. A total of 63 cases were recorded - a rise of 125% from the previous week. Photo: Gov.uk
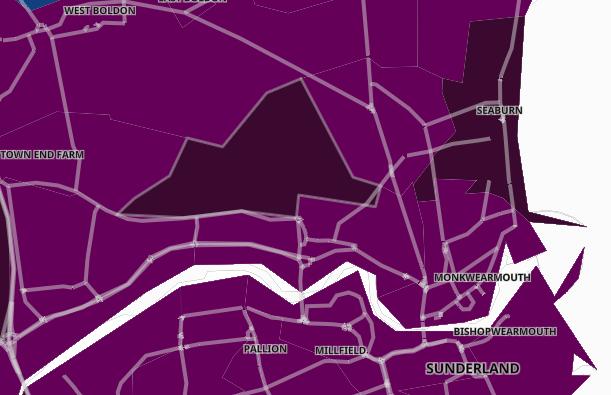
6. Hill View and Tunstall
In the seven days up to March 20, Hill View and Tunstall recorded a case rate of 815.2 per 100,000 people. A total of 82 cases were recorded - a rise of 64% from the previous week. Photo: Gov.uk
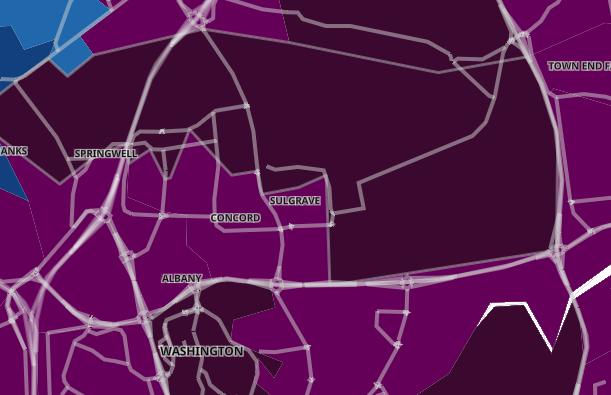
7. Springwell and Usworth
In the seven days up to March 20, Springwell and Usworth recorded a case rate of 812.9 per 100,000 people. A total of 47 cases were recorded - a rise of 56.7% from the previous week. Photo: Gov.uk
8. Hylton Red House and Marley Pots
In the seven days up to March 20, Hylton Red House and Marley Pots recorded a case rate of 800.6 per 100,000 people. A total of 70 cases were recorded - a rise of 204.3% from the previous week. Photo: Gov.uk