
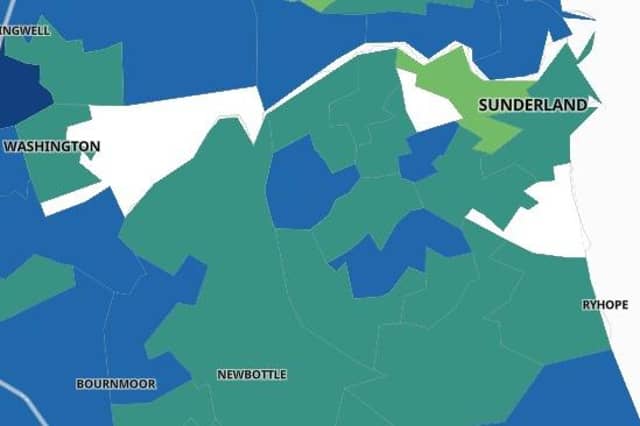

Covid-19 infections in Sunderland had been falling since March 28 however throughout the first week of June, Wearside has seen a rise in the number of infections.
According to the latest government data, Sunderland recorded a rate of 91.4 cases per 100,000 in the seven days leading up to June 8 – with 254 people testing positive for the virus.
In the seven days leading up to June 3, Wearside had its lowest case rate of the pandemic so far, with a rate of 51.5 recorded as 143 people tested positive for the illness.
Pennywell and Grindon have seen a 700% increase in the number of Covid-19 cases recorded.
Data for the last five days is unavailable as it may be inaccurate or incomplete.
Here we reveal the areas of Sunderland with the biggest increase in Covid-19 cases in the week leading up to June 8.
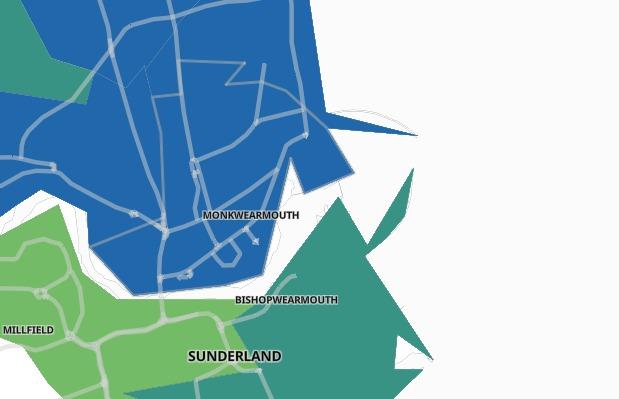
9. Monkwearmouth
In the seven days up to June 8, Monkwearmouth recorded a case rate of 104.2 per 100,000 people. A total of 10 cases were recorded - a rise of 150% from the previous week. Photo: Gov.uk
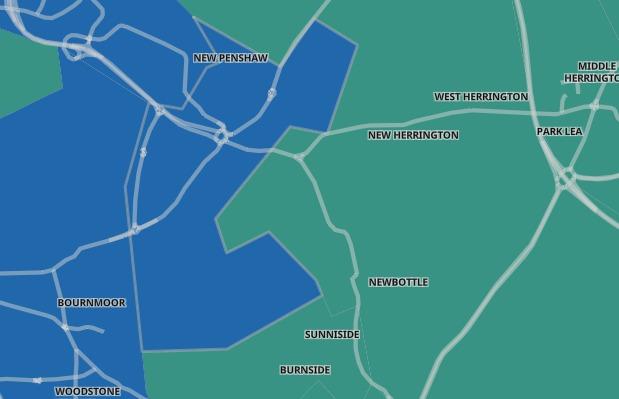
10. Shiney Row
In the seven days up to June 8, Shiney Row recorded a case rate of 129.3 per 100,000 people. A total of 12 cases were recorded - a rise of 140% from the previous week. Photo: Gov.uk
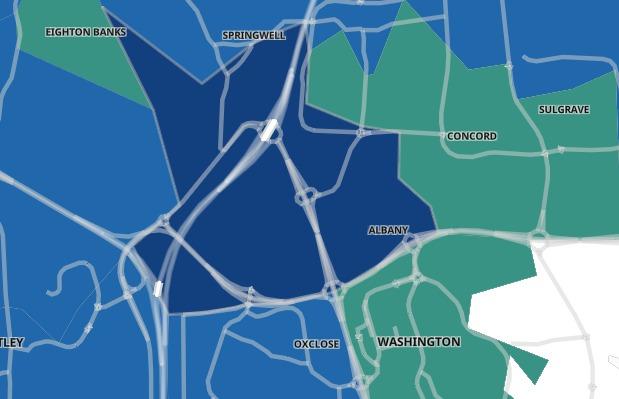
11. Albany and Blackfell
In the seven days up to June 8, Albany and Blackfell recorded a case rate of 265.8 per 100,000 people. A total of 18 cases were recorded - a rise of 100% from the previous week. Photo: Gov.uk
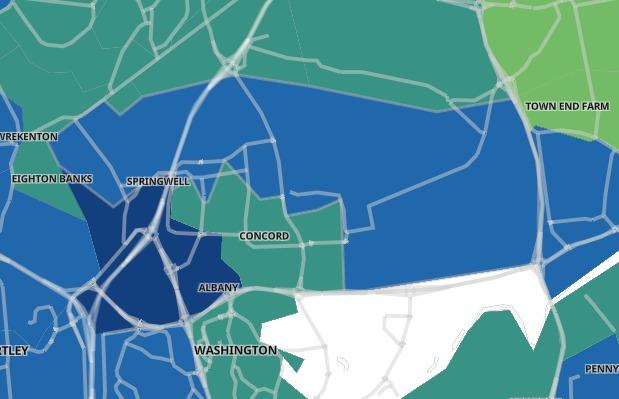
12. Springwell and Usworth
In the seven days up to June 8, Springwell and Usworth recorded a case rate of 138.4 per 100,000 people. A total of eight cases were recorded - a rise of 60% from the previous week. Photo: Gov.uk