

There was a wide disparity in how schools’ 2025 cohort of pupils performed with scores ranging from an average high of 113 to an average low of 97.
An average or individual scaled score of 110 or more indicates a pupil or pupils are working at a ‘higher standard’. To meet the ‘expected standard’, pupils must attain a scaled score of 100 or better.
The local authority’s average scaled maths score was 105, which is the same as the national average.
These are the primary schools in the city which had the lowest average scaled scores based on their pupils’ end of Key Stage 2 (Year 6) maths tests.
It’s important to note these are raw attainment scores and don’t show the progress made with pupils from differing starting points. Progress scores could not be calculated as there is an absence of Key Stage 1 baseline data available to calculate primary progress measures for this cohort due to Covid-19 disruption.
Special schools are not included in the list.
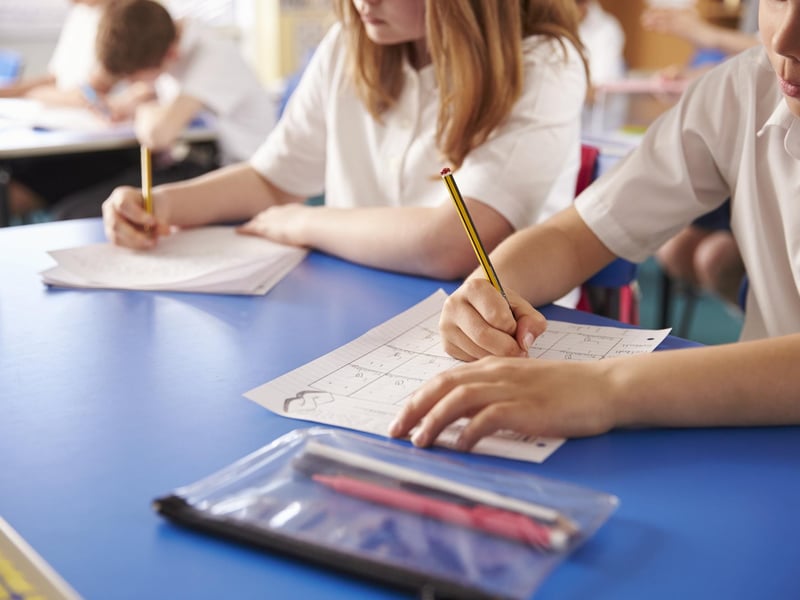
1. Primary school maths
The Department for Education has published its primary school performance data for maths. | Submitted Photo: Submitted
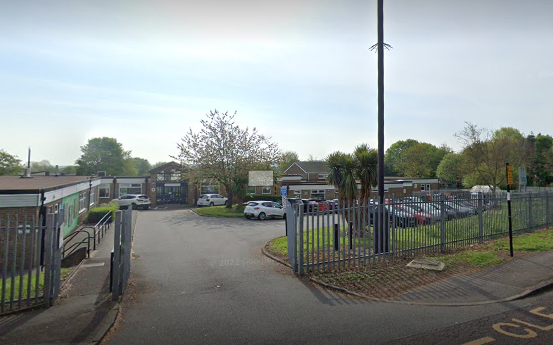
2. Barmston Village Primary School
Barmston Village Primary School saw its pupils achieve an average score in maths of 102. | Google. Photo: Google.
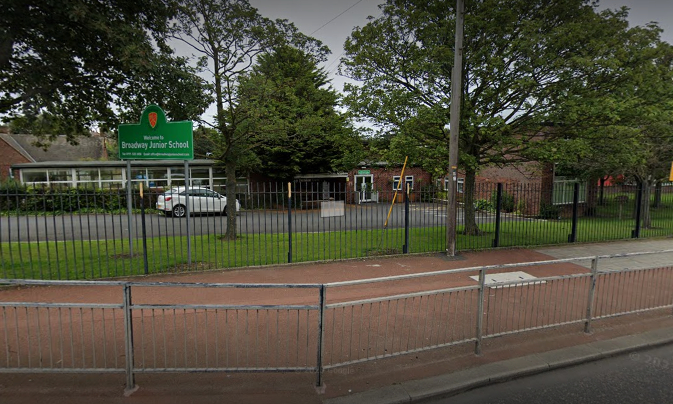
3. Broadway Junior School
Broadway Junior School saw its pupils achieve an average score in maths of 102. | Google Photo: Google
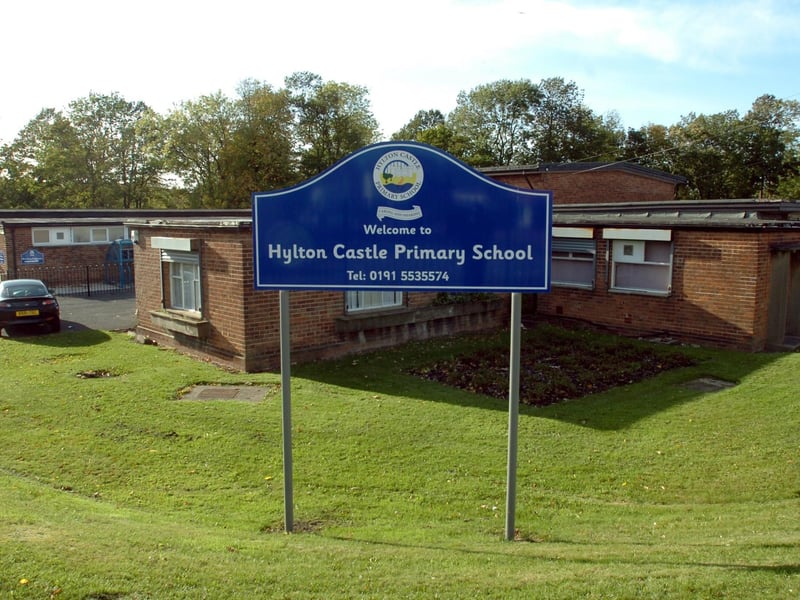
4. Hylton Castle Primary School
Hylton Castle Primary School saw its pupils achieve an average score in maths of 102. Photo: Picture by Kevin Brady