

There was a wide disparity in how schools performed with scores ranging from an average high of 113 to an average low of 97.
An average or individual scaled score of 110 or more indicates a pupil or pupils are working at a ‘higher standard’. To meet the ‘expected standard’, pupils must attain a scaled score of 100 or better.
The local authority’s average scaled maths score was 105, which is the same as the national average.
Check out the scaled average scores in maths for the city’s best performing 15 schools.

1. Primary school maths
The Department for Education has published its primary school performance data for maths. | Monkey Business - stock.adobe.com
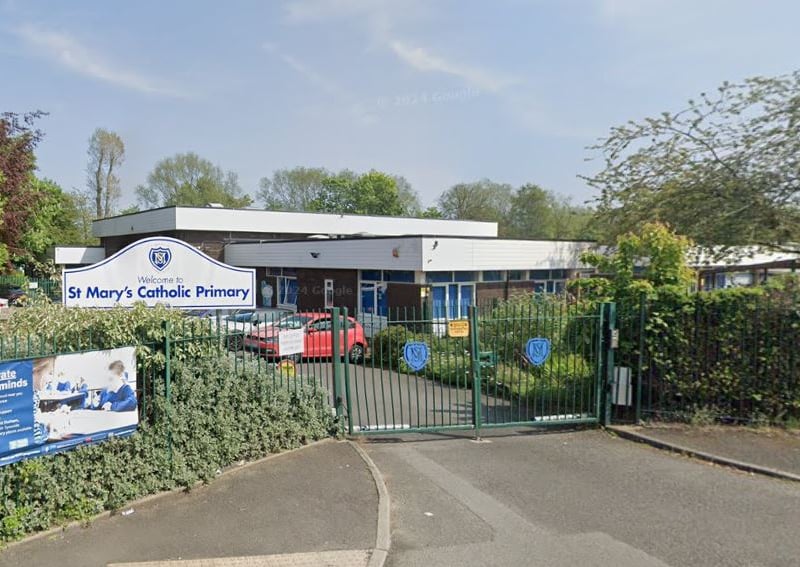
2. St Mary's Catholic Primary School, Sunderland
St Mary's Catholic Primary School, Sunderland saw its pupils achieve an average score in maths of 113. | Google
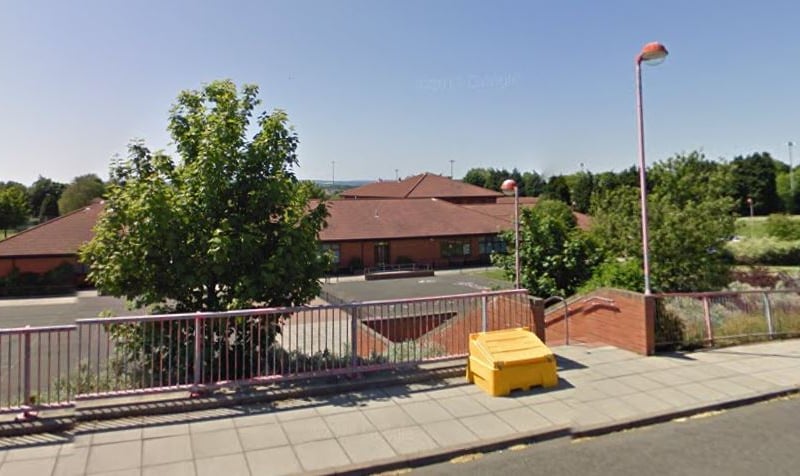
3. Bernard Gilpin Primary School
Bernard Gilpin Primary School saw its pupils achieve an average score in maths of 110. | Google
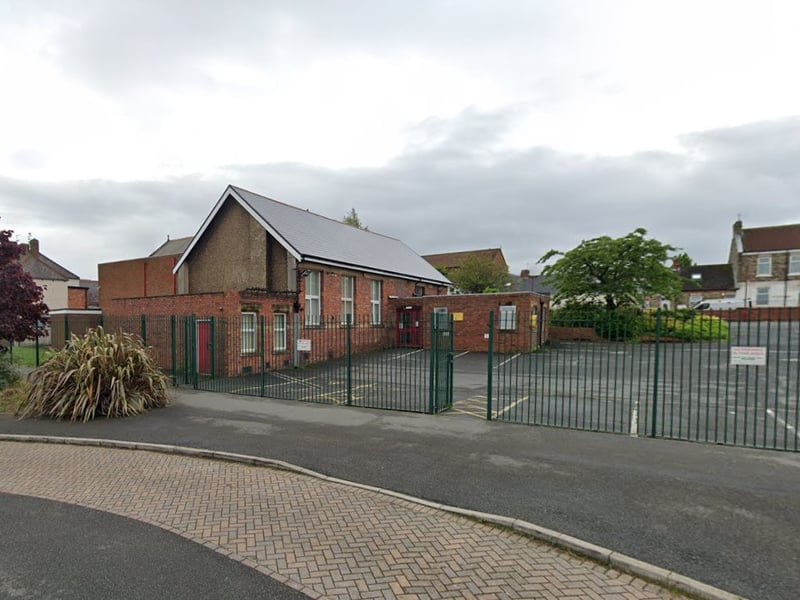
4. St Joseph's Catholic Primary School, Sunderland
St Joseph's Catholic Primary School, Sunderland saw its pupils achieve an average score in maths of 110. | Google