


On average, the latest figures (2024 cohort) showed 65% of Year 6 pupils in Sunderland were assessed as being at the expected standard, which is higher than the national average of 61%.
According to the Department for Education, pupils are meeting the expected standard if they achieve a scaled score of 100 or more in their reading and maths tests, and their teacher assesses them as 'working at the expected standard' or better in writing.
Pupils are classed as achieving at a ‘higher standard’ if they achieve a scaled score of 110 or more in their reading and maths tests, and their teacher assesses them as ‘working at a greater depth within the expected standard’ in writing.
A significant number of Sunderland schools saw a higher percentage of children meet the expected standard by the end of Year 6 compared to both the national and local authority average.
The following 14 Sunderland schools had the highest percentage of pupils meeting the expected standard by the end of Key Stage 2. It’s important to note, these are raw outcomes and, unlike previous years, don’t factor in the progress made by pupils based on their previous Key Stage 1 (Year 2) SATS assessments.
This is because there is no Key Stage 1 baseline data available to calculate primary progress measures for this year group, due to Covid-19 disruption at the time.
The list excludes special schools.
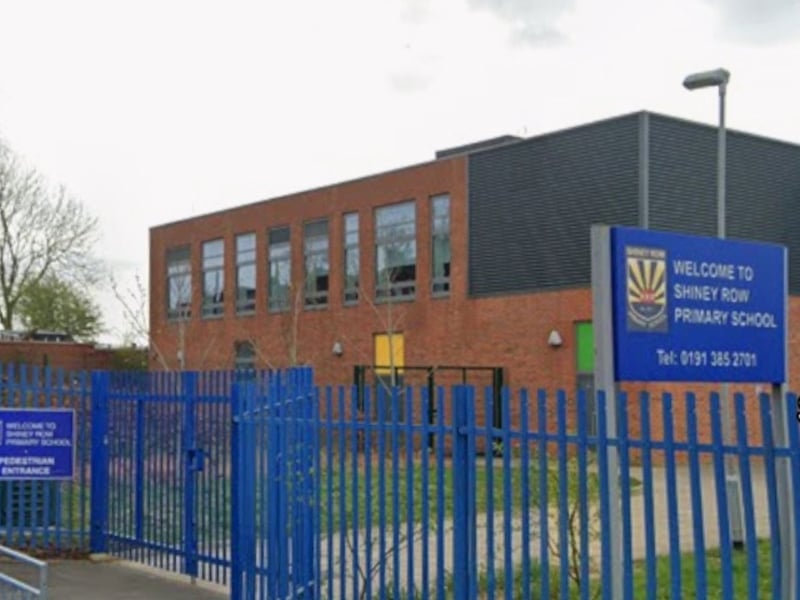
13. Shiney Row Primary School
Shiney Row Primary School achieved an average score of 104 in reading and 105 in maths. 76% of pupils met the expected standards in KS2 and 4% achieved a higher standard. | Google Photo: Google
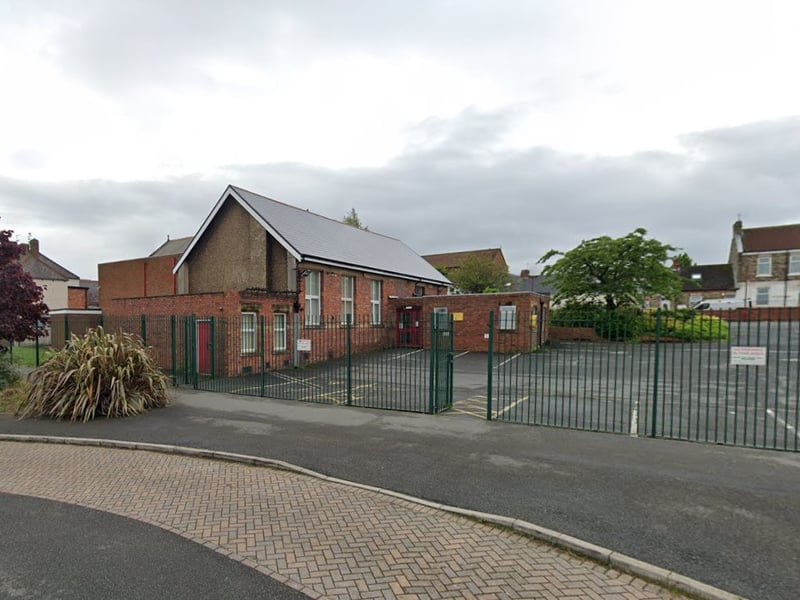
14. St Joseph's Catholic Primary School, Sunderland
St Joseph's Catholic Primary School, Sunderland achieved an average score of 107 in reading and 109 in maths. 76% of pupils met the expected standards in KS2 and 17% achieved a higher standard. | Google