


The coronavirus pandemic caused an unprecedented economic shock in the UK, closing businesses and putting people out of work left, right and centre.
But despite that, average house prices held up across England – even if there was a drop in the number of sales.
It was a slightly different picture in Sunderland, however, where overall prices fell by 1.1% in the year to September 2020. Whereas across the North East, prices rose by 0.7%.
The ONS also publishes house price figures by Middle Layer Super Output Areas (MSOAs) – small geographic areas containing an average of 7,200 people.
These show 18 of the 36 MSOAs that make up Sunderland saw a rise in house prices over the same period.
Here we reveal which neighbourhoods saw the strongest growth in the year to September 2020.
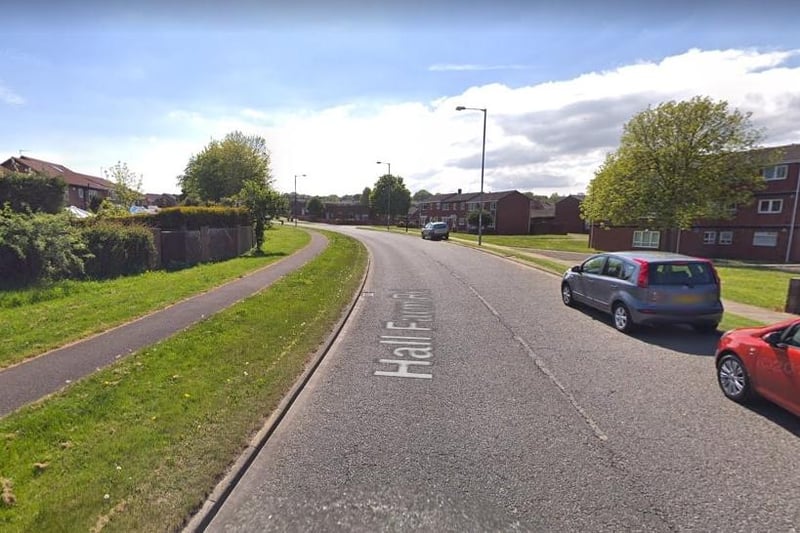
1. Hall Farm
The biggest price hike was in Hall Farm where the average price rose from £138,468 to £205,118 (up by 48.1%) on the year to September 2020. Overall, 68 houses changed hands here between October 2019 and September 2020, a rise of 5%. Photo: Google
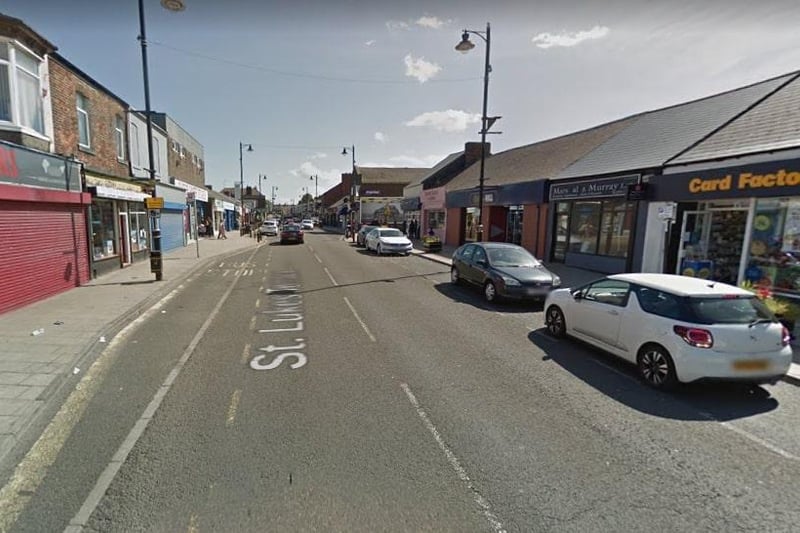
2. Pallion South and High Barnes
In Pallion South and High Barnes the average price rose from £131,607 to £146,627 (up by 11.4%) on the year to September 2020. Overall, 69 houses changed hands here between October 2019 and September 2020, a drop of 13%. Photo: Google
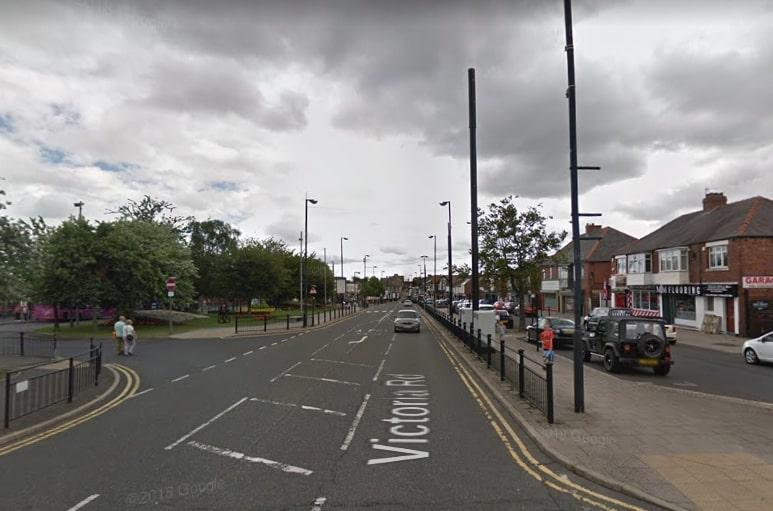
3. Concord and Sulgrave
In Concord and Sulgrave the average price rose from £71,129 to £77,953 (up by 9.6%) in the year to September 2020. Overall, 64 houses changed hands here between October 2019 and September 2020, a drop of 24%. Photo: Google
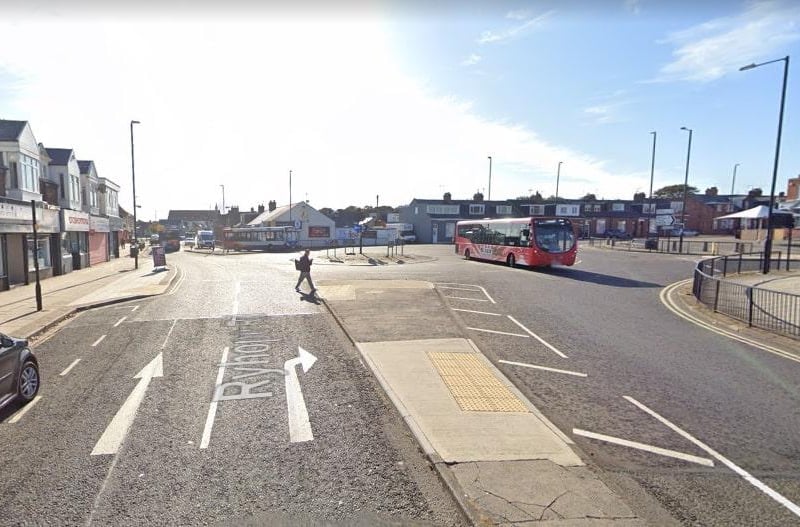
4. Grangetown
In Grangetown the average price rose from £131,745 to £143,669 (up by 9.1%) in the year to September 2020. Overall, 51 houses changed hands here between October 2019 and September 2020, a drop of 28%. Photo: Google