

Coronavirus cases have been rising across Sunderland over the last seven days – with 1,003 new cases recorded in the week up to October 9.
On October 9, Wearside had a case rate of 361 per 100,000 people.
By comparison on October 2, the city had a Covid-19 case rate of 295.8 per 100,000 people – with 822 cases in the seven day period.
Data for the last five days is not included as it may not yet be complete or accurate.
Here we reveal the areas of Sunderland that have the highest Covid-19 case rates per 100,000 people in the seven days leading up to October 9.
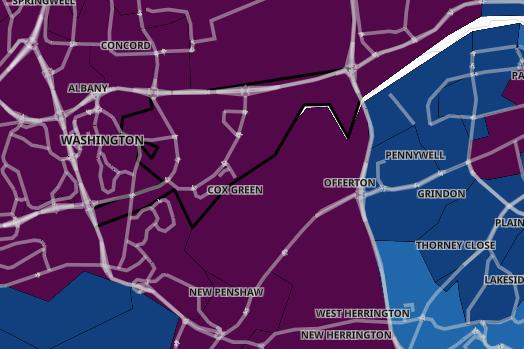
1. Columbia, Barmston and Teal Farm
In the seven days up to October 9, Columbia, Barmston and Teal Farm recorded a case rate of 722.2 per 100,000 people. A total of 59 cases were recorded - a rise of 118.5% than the previous week. Photo: Gov.uk
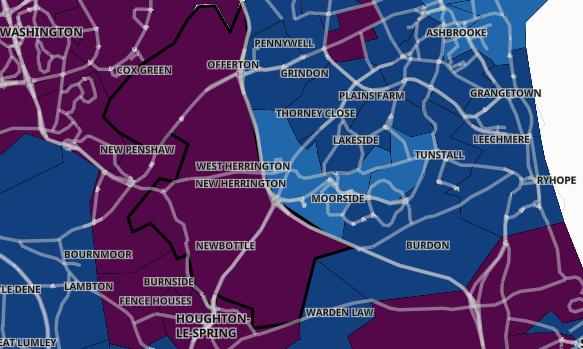
2. Newbottle and Penshaw
In the seven days up to October 9, Newbottle and Penshaw recorded a case rate of 662.8 per 100,000 people. A total of 50 cases were recorded - a rise of 47.1% than the previous week. Photo: Gov.uk
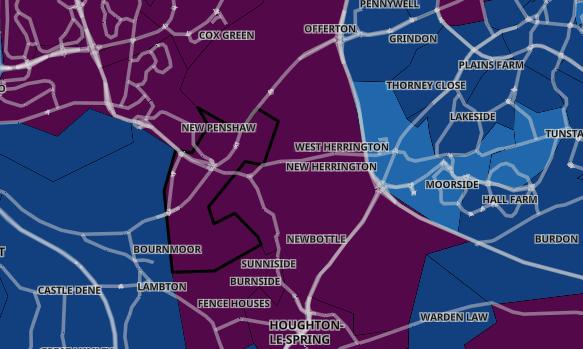
3. Shiney Row
In the seven days up to October 9, Shiney Row recorded a case rate of 624.9 per 100,000 people. A total of 58 cases were recorded - a rise of 31.8% than the previous week. Photo: Gov.uk
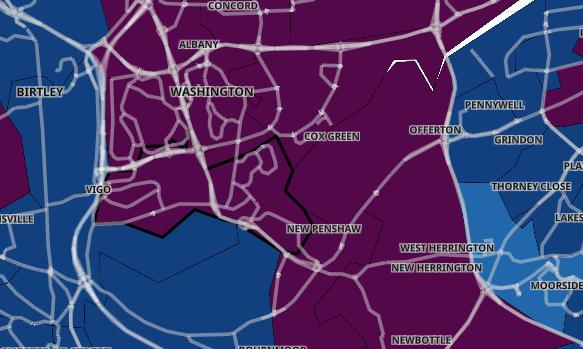
4. Harraton, Rickleton and Fatfield
In the seven days up to October 9, Harraton, Rickleton and Fatfield recorded a case rate of 607.9 per 100,000 people. A total of 60 cases were recorded - a rise of 25% than the previous week. Photo: Gov.uk