

The figures, from the Office of National Statistics, cover a five-year period from 2014 to 2019.
From Ryhope to St Peter’s, these are the Sunderland City Council wards where numbers are on the up.
A Message from the Editor
Support your Echo and become a subscriber today. Enjoy unlimited access to local news, the latest on SAFC and new puzzles every day. With a digital subscription, you can see fewer ads, enjoy faster load times, and get access to exclusive newsletters and content. Click here to subscribe.
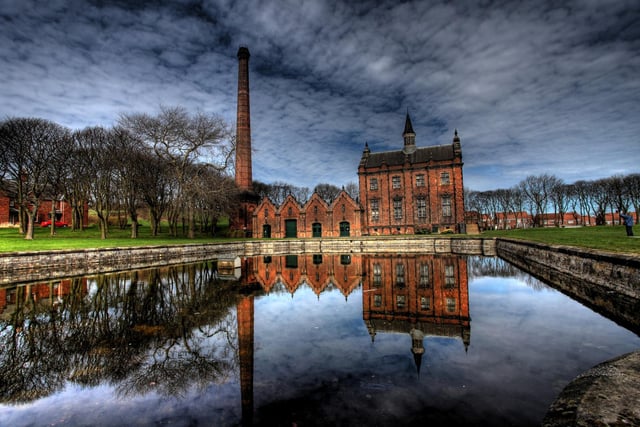
1. No 1: Ryhope
Population in 2019:11,165 Population in 2014: 10,517 Increase: 648 Percentage rise: 6.2 Photo: kc
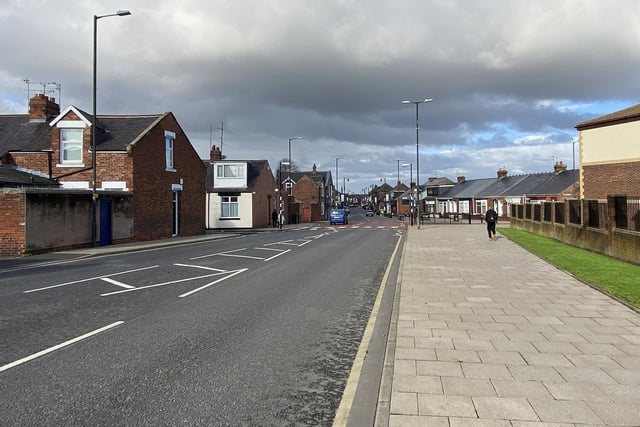
2. No 2: Pallion
Population in 2019: 10,822 Population in 2014: 10,223 Increase: 599 Percentage rise: 5.9 Photo: Frank Reid
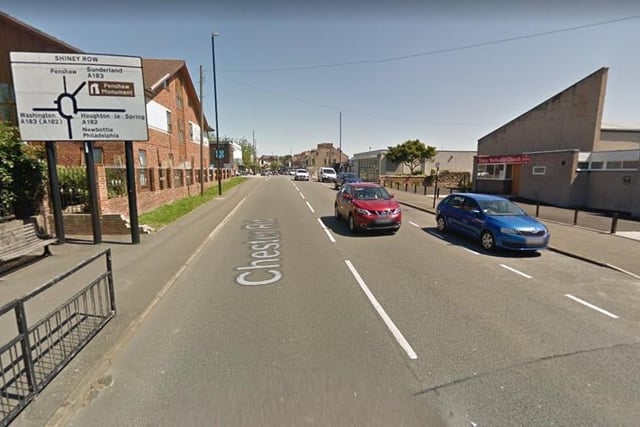
3. No 3: Shiney Row
Population in 2019: 13,212 Population in 2014: 12,649 Increase: 563 Percentage rise: 4.5 Picture: Google Images Photo: Google
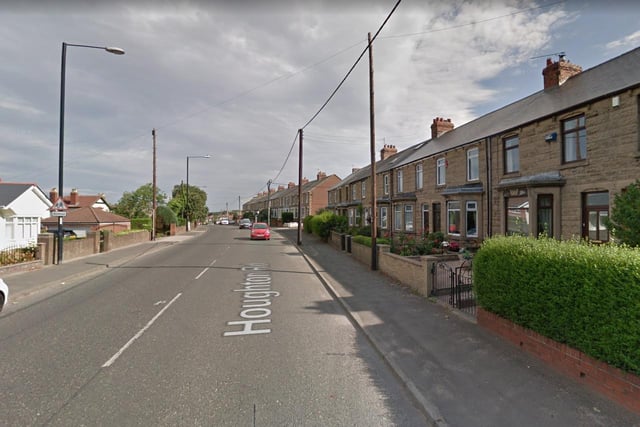
4. No 4. Hetton
Population in 2019: 11, 886 Population in 2014: 11,436 Increase: 450 Percentage rise: 3.9 Picture: Google Images Photo: kc
1 / 3