These are the areas in and around Sunderland with the highest and lowest numbers of coronavirus deaths

and live on Freeview channel 276
Data released by the Office for National Statistics (ONS) on Friday, June 12 lists the total number of deaths per area for the Sunderland local authority, and shows which percentage of these are related to coronavirus.
According to the figures, there have been 1,041 deaths recorded in the city between March 1, 2020 and May 31, 2020.
Of these, 330 were related to coronavirus.
Advertisement
Hide AdAdvertisement
Hide Ad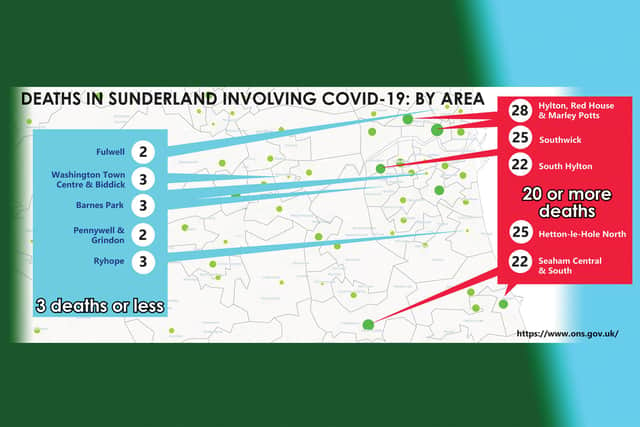

This means 32% of deaths recorded in Sunderland between those dates were Covid-related.
NHS England’s latest figures, released on Thursday, June 11, say that 323 patients at South Tyneside and Sunderland NHS Foundation Trust have died after contracting coronavirus.
Hylton Red House & Marley Pots have the largest number of coronavirus deaths for a Sunderland area, with 28 Covid deaths recorded during the same time period.
As a percentage of total number of deaths, Barnes Park has the highest as there were six total deaths recorded in that area, with three of them linked to the virus.
Advertisement
Hide AdAdvertisement
Hide AdPennywell and Grindon have the lowest percentage of coronavirus-related deaths (10%).
Here is a full breakdown of deaths in Sunderland – including the number and equivalent percentage of deaths where a person had contracted coronavirus – by area.
The figures are for between March 1, 2020 and May 31, 2020:
(Area: number of Covid-related deaths, total number of deaths, Covid deaths as a percentage of total deaths)
Barnes Park: 3, 6, 50%
Southwick: 25, 51, 49%
Hetton-le-Hole North: 25, 54, 46%
South Hylton: 22, 48, 46%
Hylton Red House & Marley Pots: 28, 62, 45%
Seaham Central & South (County Durham): 22, 53, 42%
Hill View & Tunstall: 19, 46, 41%
Peterlee South (County Durham): 9, 23, 39%
Pallion North: 14, 36, 39%
Easington & Hawthorn (County Durham): 7, 18, 39%
Harraton, Rickleton & Fatfield: 13, 35, 37%
Sunderland Central & Deptford: 7, 19, 37%
Hetton-le-Hole South: 11, 31, 35%
Lakeside & Farringdon: 12, 34, 35%
Seaham Northlea & Westlea (County Durham): 12, 34, 35%
Peterlee East (County Durham): 17, 49, 35%
North Hylton: 12, 35, 34%
Oxclose and Lambton: 4, 12, 33%
Hall Farm: 5, 15, 33%
Newbottle & Penshaw: 16, 49, 33%
South Murton & South Hetton (County Durham): 10, 31, 32%
Columbia, Barmston & Teal Farm: 6, 19, 32%
Pallion South & High Barnes: 14, 47, 30%
Monkwearmouth: 8, 27, 30%
Albany and Blackfell: 4, 15, 27%
Hendon & Docks: 8, 30, 27%
Town End Farm: 4, 16, 25%
Shiney Row: 7, 29, 24%
Houghton West: 6, 25, 24%
Herrington & Doxford: 4, 17, 24%
Houghton Town: 7, 30, 23%
Springwell & Usworth: 6, 27, 22%
Millfield: 4, 18, 22%
Grangetown: 7, 34, 21%
Ryhope: 3, 15, 20%
Peterlee West (County Durham): 4, 20, 20%
Silksworth: 5, 26, 19%
Thorney Close & Plains Farm: 5, 27, 19%
Concord and Sulgrave: 4, 22, 18%
Fulwell: 2, 12, 17%
Washington Town Centre & Biddick: 3, 18, 17%
Seaburn: 5, 34, 15%
Pennywell and Grindon: 2, 20, 10%