

Coronavirus cases have been rising across Sunderland since August 14 – with 1,048 new cases confirmed in the week leading up to September 3.
On August 14, Sunderland recorded a case rate of 230 per 100,000 people which was a total of 639 cases recorded.
By comparison, Wearside recorded a Covid-19 case rate of 377.2 per 100,00 people in the seven days leading up to September 3 – a difference of 409 more cases.
Data for the last five days is not included as it may not yet be complete or accurate.
Here we reveal the areas of Sunderland that have the highest Covid-19 case rates per 100,000 people in the seven days leading up to September 3.
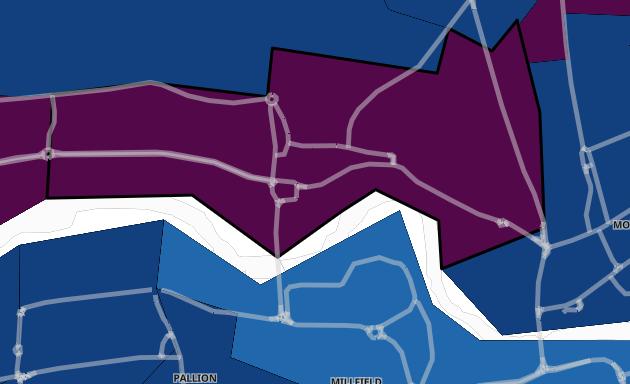
1. Southwick
In the seven days up to September 3, Southwick recorded a case rate of 590.1 per 100,000 people. A total of 44 cases were recorded - a rise of 109.5% than the previous week. Photo: Gov.uk
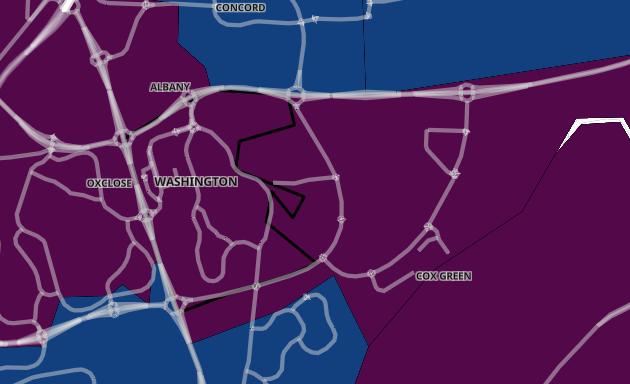
2. Washington Town Centre and Biddick
In the seven days up to September 3, Washington Town Centre and Biddick recorded a case rate of 559.8 per 100,000 people. A total of 36 cases were recorded - a rise of 80% than the previous week. Photo: Gov.uk
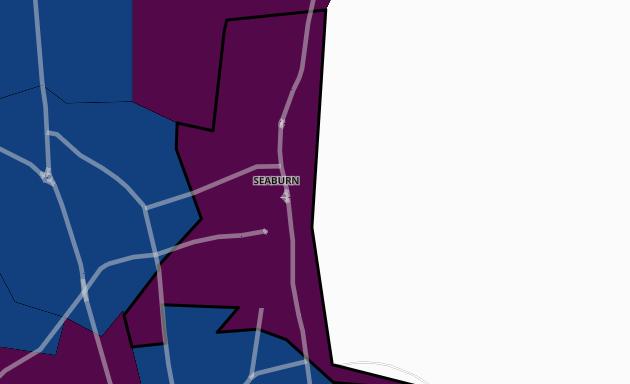
3. Seaburn
In the seven days up to September 3, Seaburn recorded a case rate of 507 per 100,000 people. A total of 34 cases were recorded - a rise of 47.8% than the previous week. Photo: Gov.uk
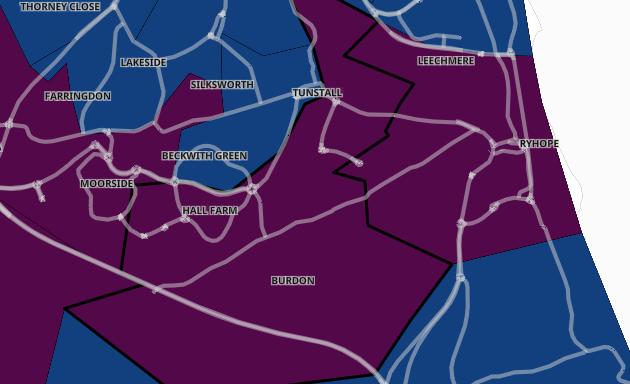
4. Hall Farm
In the seven days up to September 3, Hall Farm recorded a case rate of 487.5 per 100,000 people. A total of 27 cases were recorded - a rise of 28.6% than the previous week. Photo: Gov.uk