

Using data from WyScout, we've examined some of the key performance data in the third tier to see how Sunderland compare to their promotion rivals.
Scroll down and click through the pages to see whether Phil Parkinson's side are on a par with the top eight - or lagging behind in their quest for promotion:
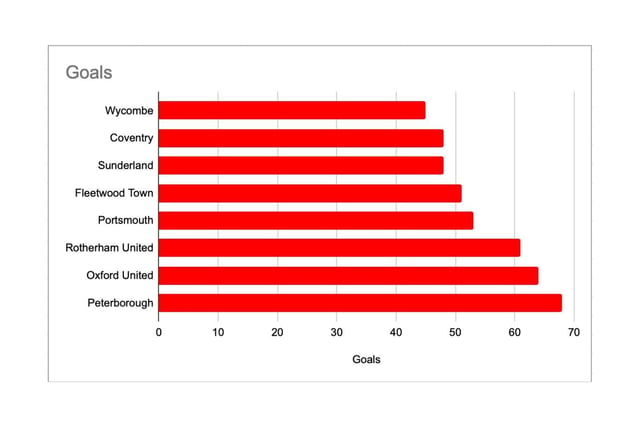
1. GOALS
A simple barometer, but an area where Sunderland have struggled in recent weeks. Of the top eight, only Wycombe and Coventry have scored less than Sunderland's 48 - although the Sky Blues sit top, showing that goals aren't everything in the battle for promotion. Unsurprisingly, attack-minded Peterborough lead the way. Photo: Other
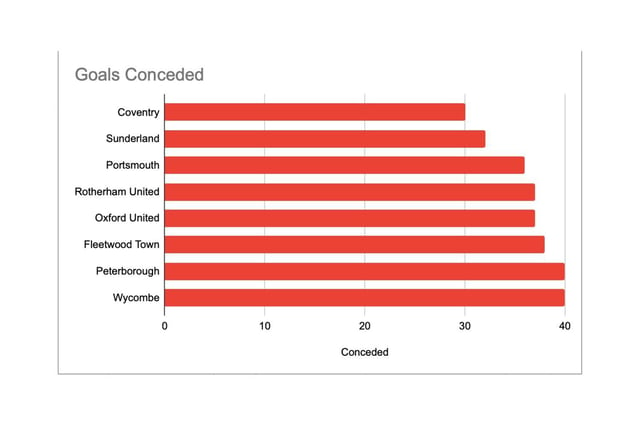
2. GOALS CONCEDED
The Black Cats have a stellar defensive record, with their 32 goals conceded the second best of the top eight. Only Coventry have a better record. Strong foundations to build off at the back, then. Photo: Other
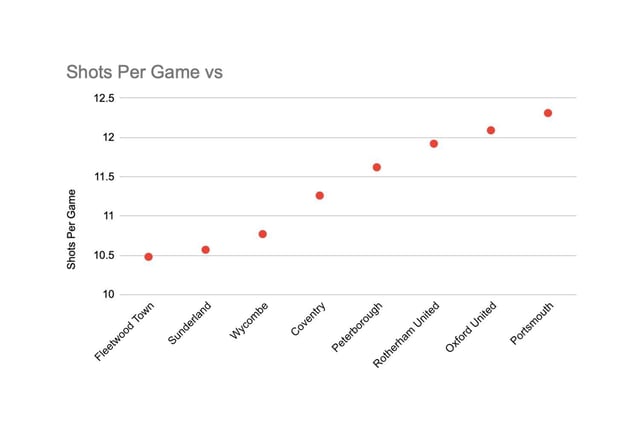
3. SHOTS PER GAME
Chances created, or indeed the lack of them, has been a hot topic at the Stadium of Light in recent weeks. It's interesting, therefore, to see that of the top eight only Fleetwood have less shots per game than the Black Cats - whose tally stands at 10.57. Parkinson's men are averaging almost two shots a game less than promotion rivals Portsmouth and Oxford United. Photo: Other
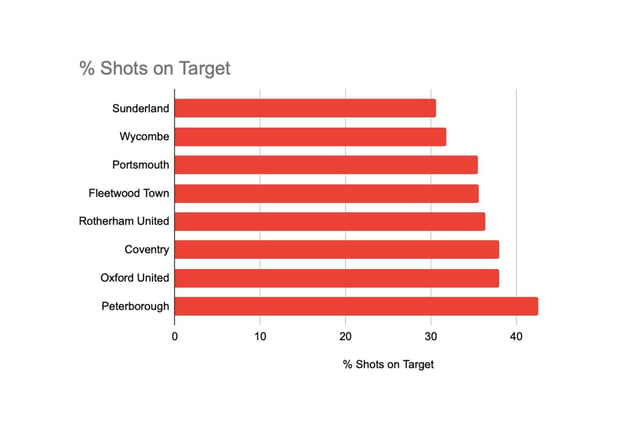
4. % OF SHOTS ON TARGET
More concerningly, only 30.6% of Sunderland's shots this season have been on target - the lowest of any side in the top eight. In contrast, 42.6% of Peterborough's efforts hit the target. Photo: Other